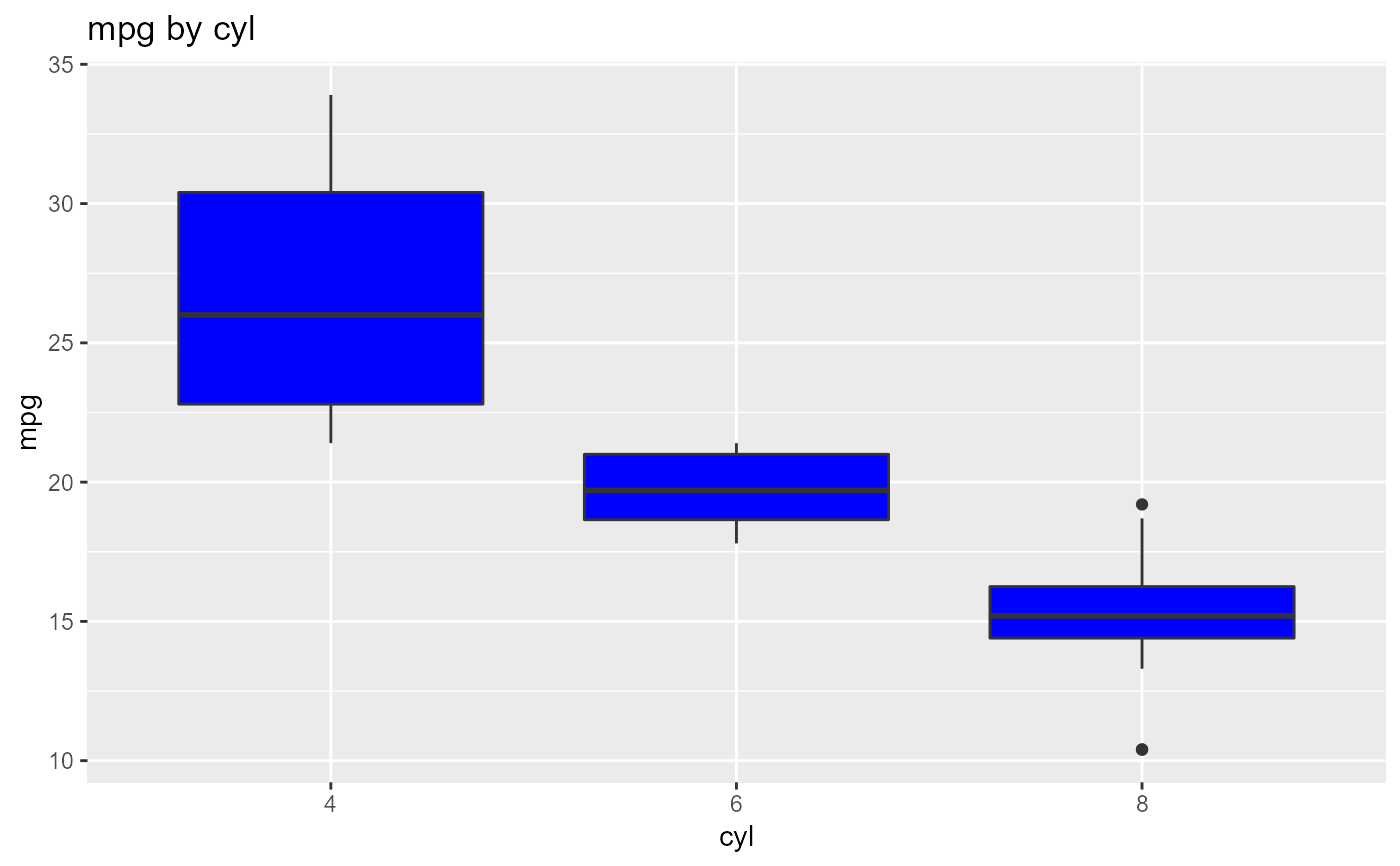
Descriptive statistics of a continuous variable for the different levels of
a categorical variable. boxplot.group_summary() creates boxplots of
the continuous variable for the different levels of the categorical variable.
Usage
ds_group_summary(data, group_by, cols)

# S3 method for class 'ds_group_summary'
plot(x, print_plot = TRUE, ...)Value
ds_group_summary() returns an object of class "ds_group_summary".
An object of class "ds_group_summary" is a list containing the
following components:
- stats
A data frame containing descriptive statistics for the different levels of the factor variable.
- tidy_stats
A tibble containing descriptive statistics for the different levels of the factor variable.
- plotdata
Data for boxplot method.
Examples
# ds_group summary
ds_group_summary(mtcarz, cyl, mpg)
#>                                            by
#> -----------------------------------------------------------------------------------------
#> |     Statistic/Levels|                    4|                    6|                    8|
#> -----------------------------------------------------------------------------------------
#> |                  Obs|                   11|                    7|                   14|
#> |              Minimum|                 21.4|                 17.8|                 10.4|
#> |              Maximum|                 33.9|                 21.4|                 19.2|
#> |                 Mean|                26.66|                19.74|                 15.1|
#> |               Median|                   26|                 19.7|                 15.2|
#> |                 Mode|                 22.8|                   21|                 10.4|
#> |       Std. Deviation|                 4.51|                 1.45|                 2.56|
#> |             Variance|                20.34|                 2.11|                 6.55|
#> |             Skewness|                 0.35|                -0.26|                -0.46|
#> |             Kurtosis|                -1.43|                -1.83|                 0.33|
#> |       Uncorrected SS|              8023.83|              2741.14|              3277.34|
#> |         Corrected SS|               203.39|                12.68|                 85.2|
#> |      Coeff Variation|                16.91|                 7.36|                16.95|
#> |      Std. Error Mean|                 1.36|                 0.55|                 0.68|
#> |                Range|                 12.5|                  3.6|                  8.8|
#> |  Interquartile Range|                  7.6|                 2.35|                 1.85|
#> -----------------------------------------------------------------------------------------

# boxplot
k <- ds_group_summary(mtcarz, cyl, mpg)
plot(k)


# tibble
k$tidy_stats
#> # A tibble: 3 × 15
#>   cyl   length   min   max  mean median  mode    sd variance skewness kurtosis
#>   <fct>  <int> <dbl> <dbl> <dbl>  <dbl> <dbl> <dbl>    <dbl>    <dbl>    <dbl>
#> 1 4         11  21.4  33.9  26.7   26    22.8  4.51    20.3     0.348   -1.43
#> 2 6          7  17.8  21.4  19.7   19.7  21    1.45     2.11   -0.259   -1.83
#> 3 8         14  10.4  19.2  15.1   15.2  10.4  2.56     6.55   -0.456    0.330
#> # ℹ 4 more variables: coeff_var <dbl>, std_error <dbl>, range <dbl>, iqr <dbl>
# tibble
k$tidy_stats
#> # A tibble: 3 × 15
#> cyl length min max mean median mode sd variance skewness kurtosis
#> <fct> <int> <dbl> <dbl> <dbl> <dbl> <dbl> <dbl> <dbl> <dbl> <dbl>
#> 1 4 11 21.4 33.9 26.7 26 22.8 4.51 20.3 0.348 -1.43
#> 2 6 7 17.8 21.4 19.7 19.7 21 1.45 2.11 -0.259 -1.83
#> 3 8 14 10.4 19.2 15.1 15.2 10.4 2.56 6.55 -0.456 0.330
#> # ℹ 4 more variables: coeff_var <dbl>, std_error <dbl>, range <dbl>, iqr <dbl>