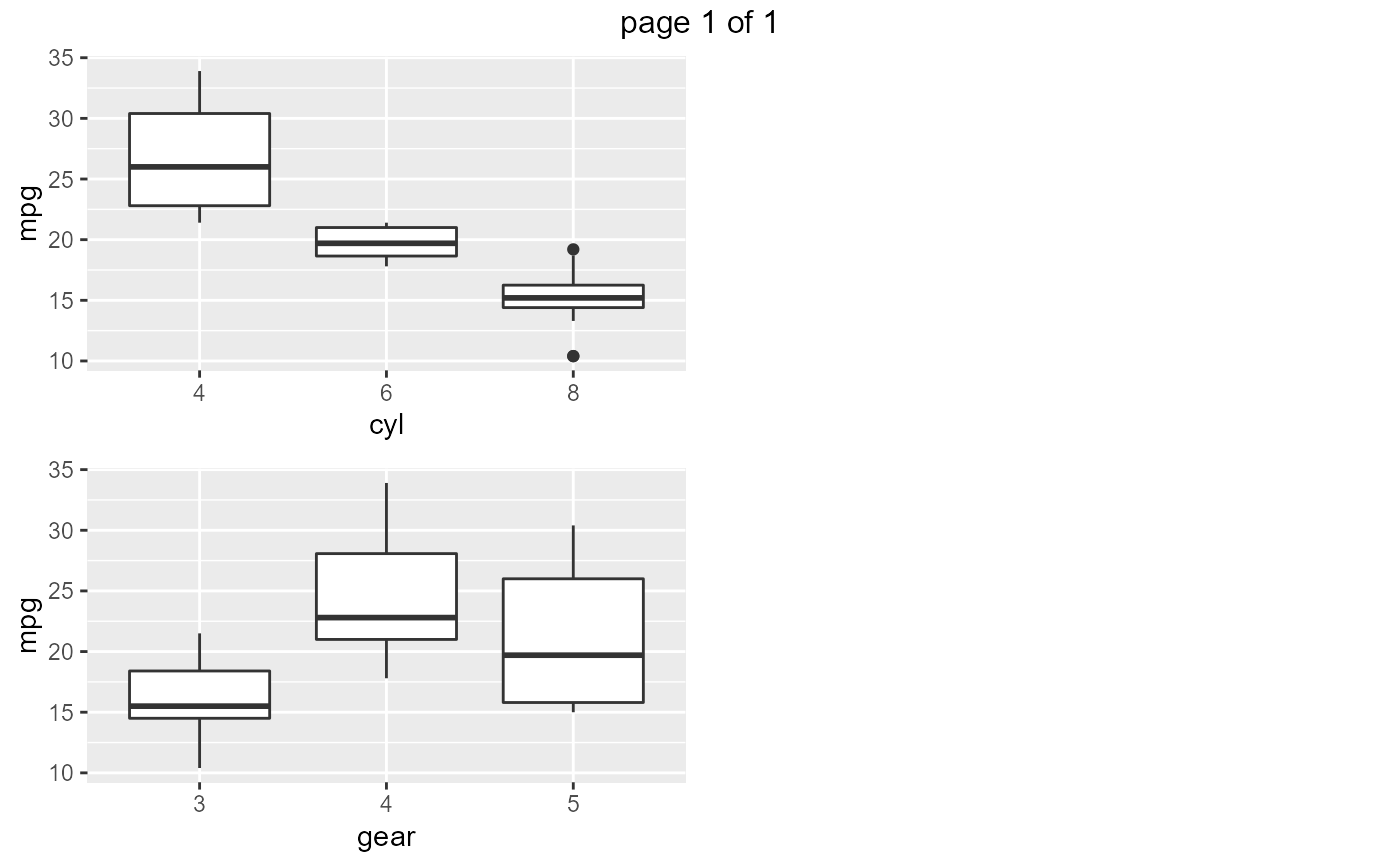
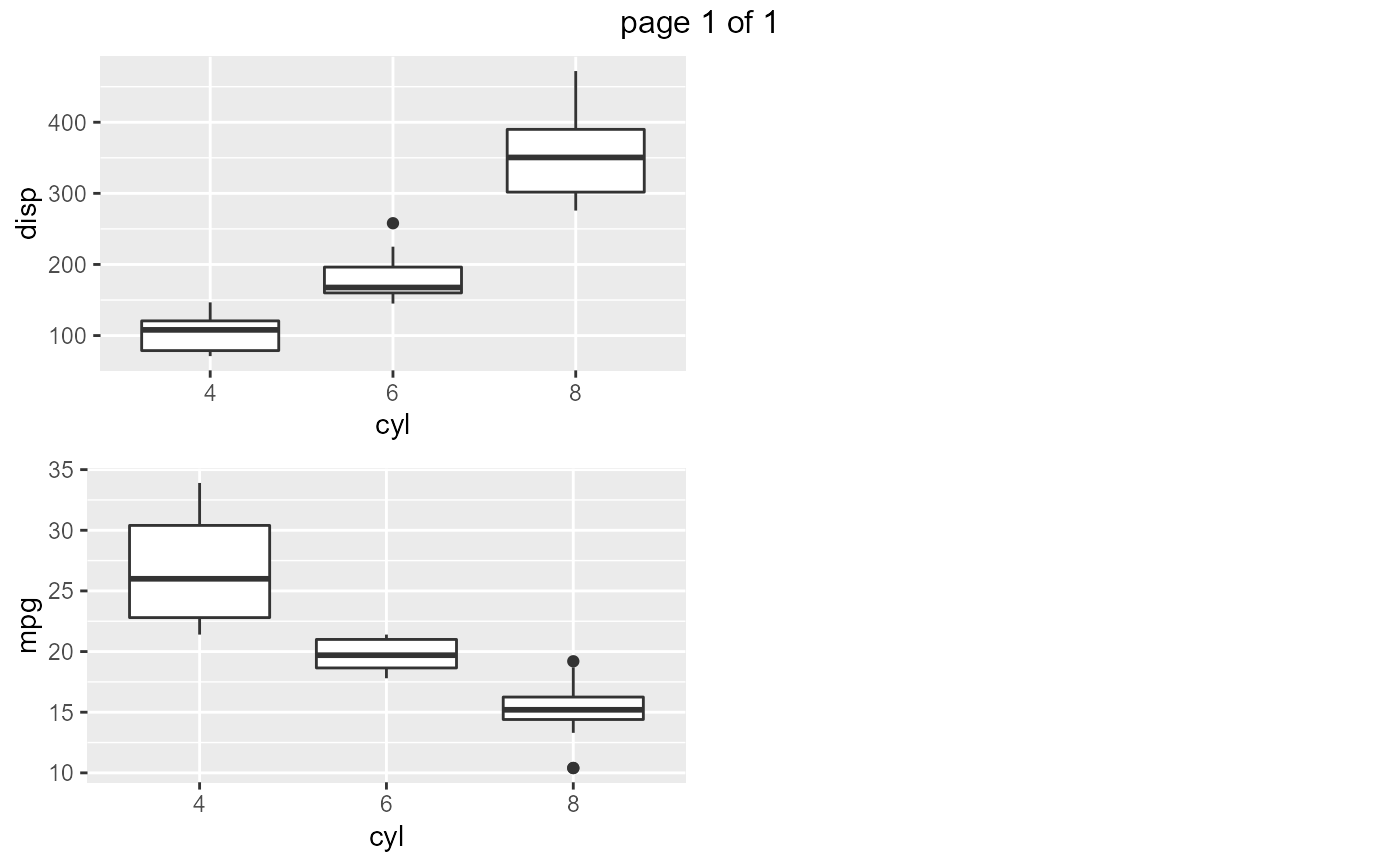
Creates box plots if the data has both categorical & continuous variables.
ds_plot_box_group(data, ..., print_plot = TRUE)
Arguments
| data | A |
|---|---|
| ... | Column(s) in |
| print_plot | logical; if |
Examples
# subset data mt <- dplyr::select(mtcarz, cyl, disp, mpg) # plot select variables ds_plot_box_group(mtcarz, cyl, gear, mpg)# plot all variables ds_plot_box_group(mt)