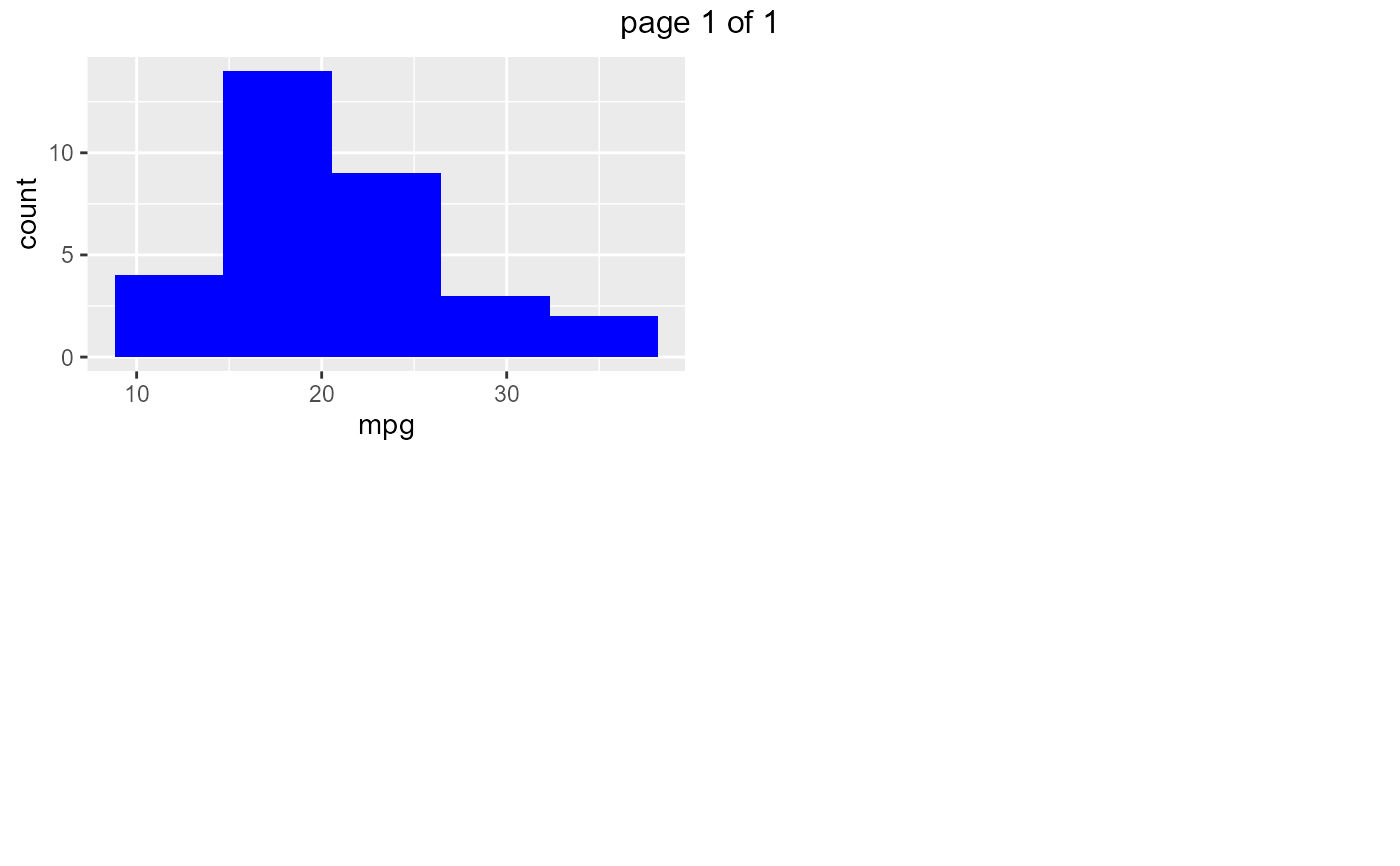
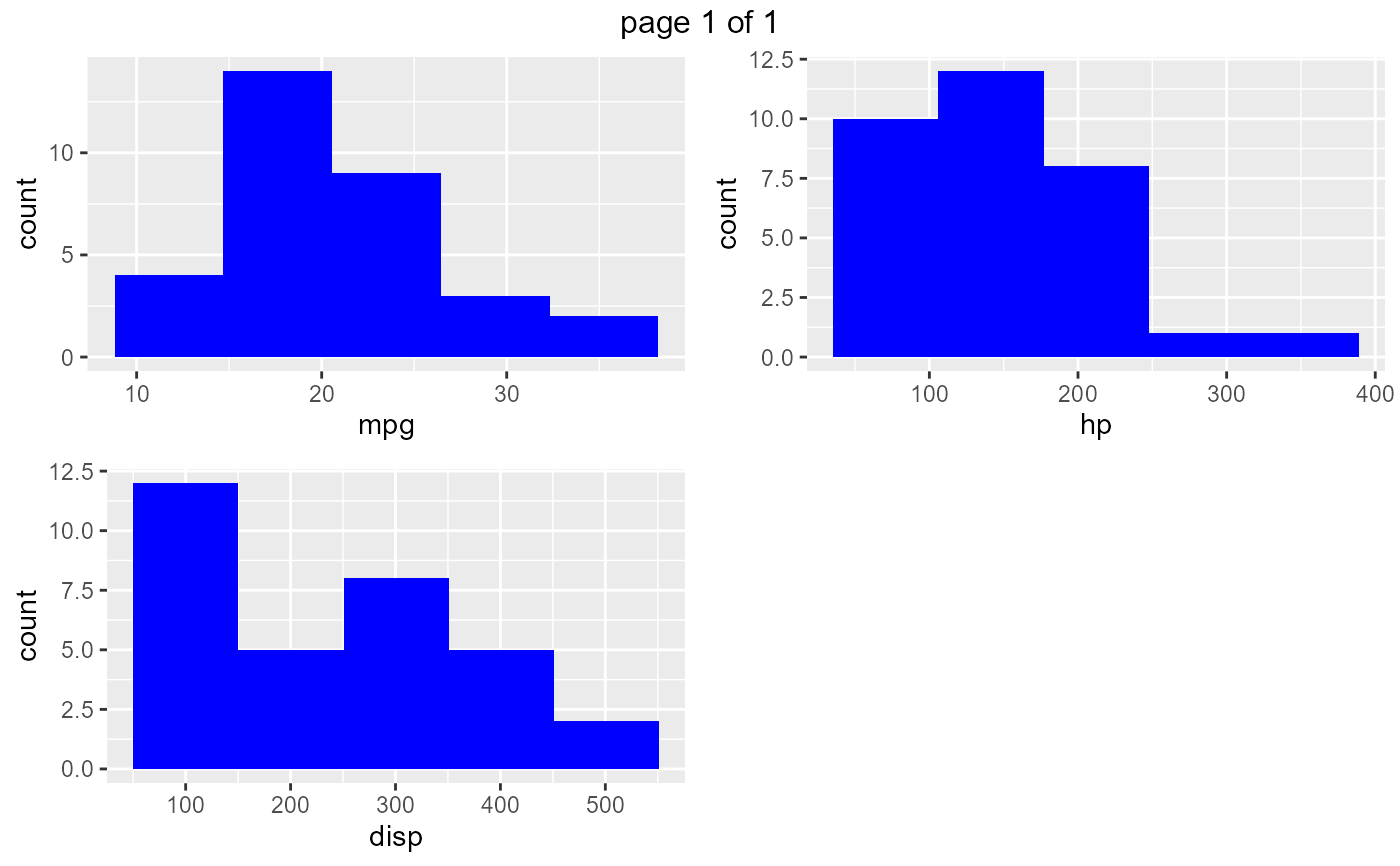
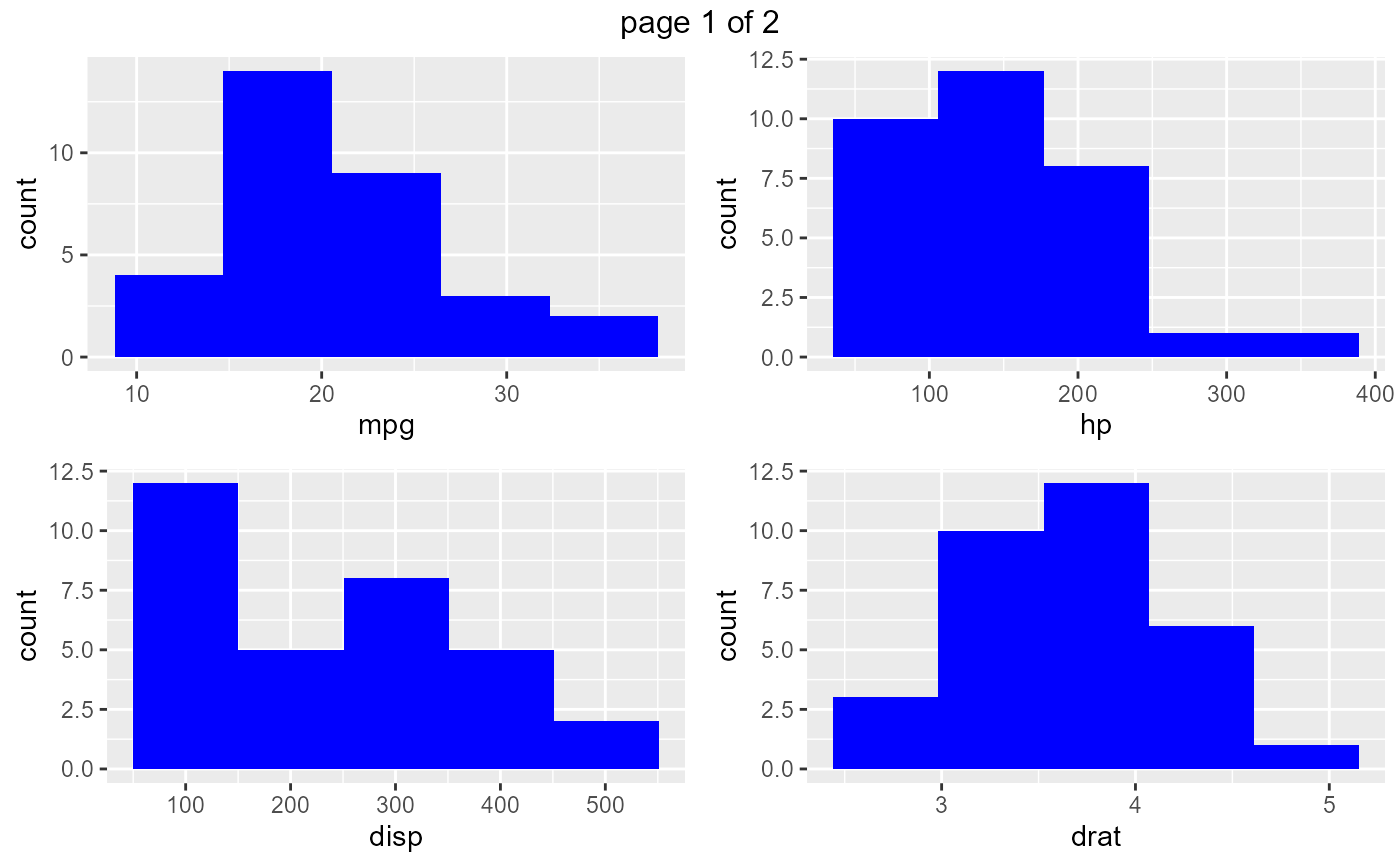
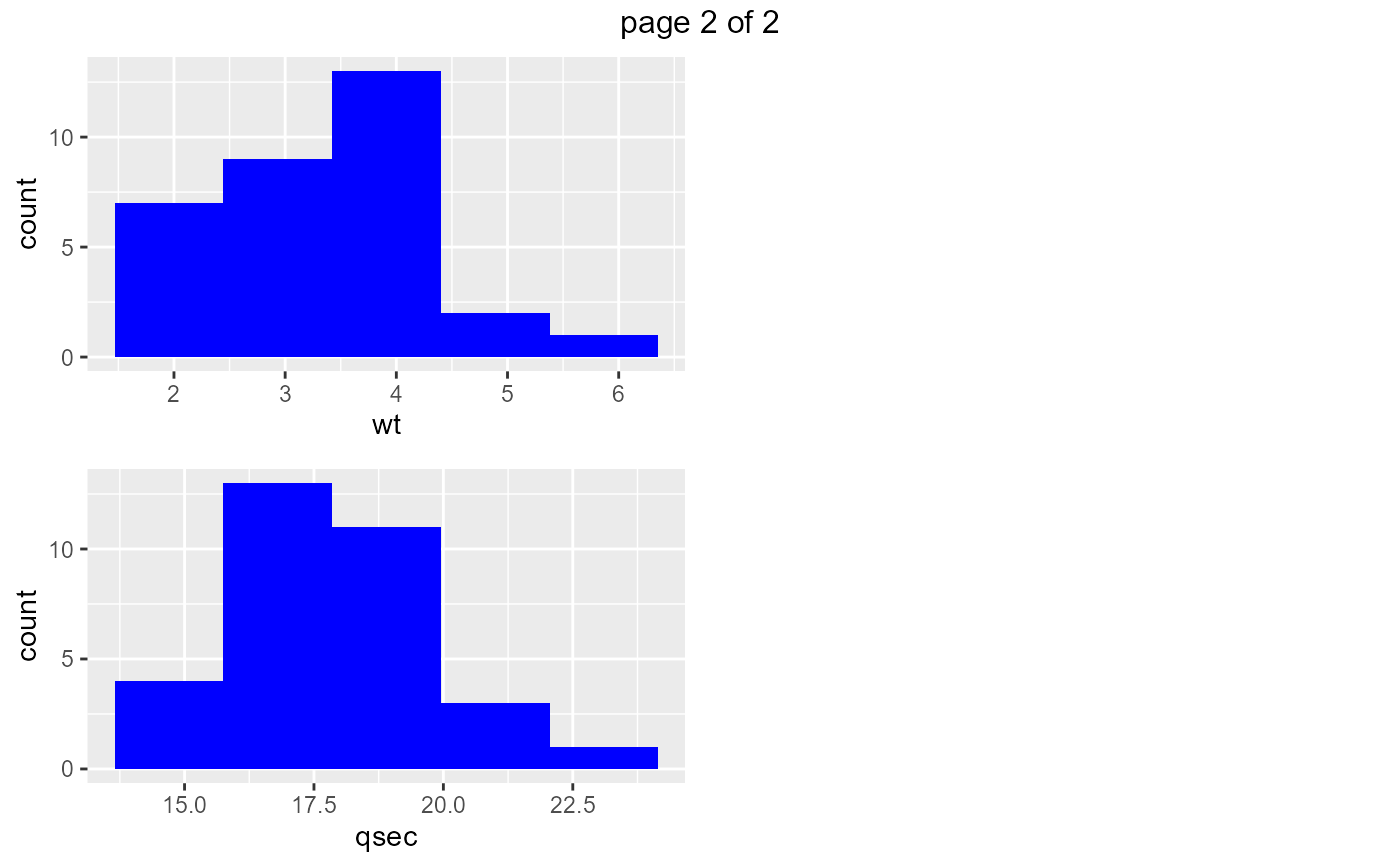
Creates histograms if the data has continuous variables.
ds_plot_histogram(data, ..., bins = 5, fill = "blue", print_plot = TRUE)
Arguments
| data | A |
|---|---|
| ... | Column(s) in |
| bins | Number of bins in the histogram. |
| fill | Color of the histogram. |
| print_plot | logical; if |
Examples
# plot single variable ds_plot_histogram(mtcarz, mpg)# plot multiple variables ds_plot_histogram(mtcarz, mpg, disp, hp)# plot all variables ds_plot_histogram(mtcarz)