Creates two way tables of categorical variables. The tables created can be visualized as bar plots and mosaic plots.
Usage
ds_cross_table(data, var_1, var_2)

# S3 method for class 'ds_cross_table'
plot(x, stacked = FALSE, proportional = FALSE, print_plot = TRUE, ...)

ds_twoway_table(data, var_1, var_2)
Arguments
- data
A
data.frameor atibble.- var_1
First categorical variable.
- var_2
Second categorical variable.
- x
An object of class
cross_table.- stacked
If
FALSE, the columns of height are portrayed as stacked bars, and ifTRUEthe columns are portrayed as juxtaposed bars.- proportional
If
TRUE, the height of the bars is proportional.- print_plot
logical; if
TRUE, prints the plot else returns a plot object.- ...
Further arguments to be passed to or from methods.
Examples
# cross table
k <- ds_cross_table(mtcarz, cyl, gear)
k
#> Cell Contents
#> |---------------|
#> | Frequency |
#> | Percent |
#> | Row Pct |
#> | Col Pct |
#> |---------------|
#>
#> Total Observations: 32
#>
#> ----------------------------------------------------------------------------
#> | | gear |
#> ----------------------------------------------------------------------------
#> | cyl | 3 | 4 | 5 | Row Total |
#> ----------------------------------------------------------------------------
#> | 4 | 1 | 8 | 2 | 11 |
#> | | 0.031 | 0.25 | 0.062 | |
#> | | 0.09 | 0.73 | 0.18 | 0.34 |
#> | | 0.07 | 0.67 | 0.4 | |
#> ----------------------------------------------------------------------------
#> | 6 | 2 | 4 | 1 | 7 |
#> | | 0.062 | 0.125 | 0.031 | |
#> | | 0.29 | 0.57 | 0.14 | 0.22 |
#> | | 0.13 | 0.33 | 0.2 | |
#> ----------------------------------------------------------------------------
#> | 8 | 12 | 0 | 2 | 14 |
#> | | 0.375 | 0 | 0.062 | |
#> | | 0.86 | 0 | 0.14 | 0.44 |
#> | | 0.8 | 0 | 0.4 | |
#> ----------------------------------------------------------------------------
#> | Column Total | 15 | 12 | 5 | 32 |
#> | | 0.468 | 0.375 | 0.155 | |
#> ----------------------------------------------------------------------------
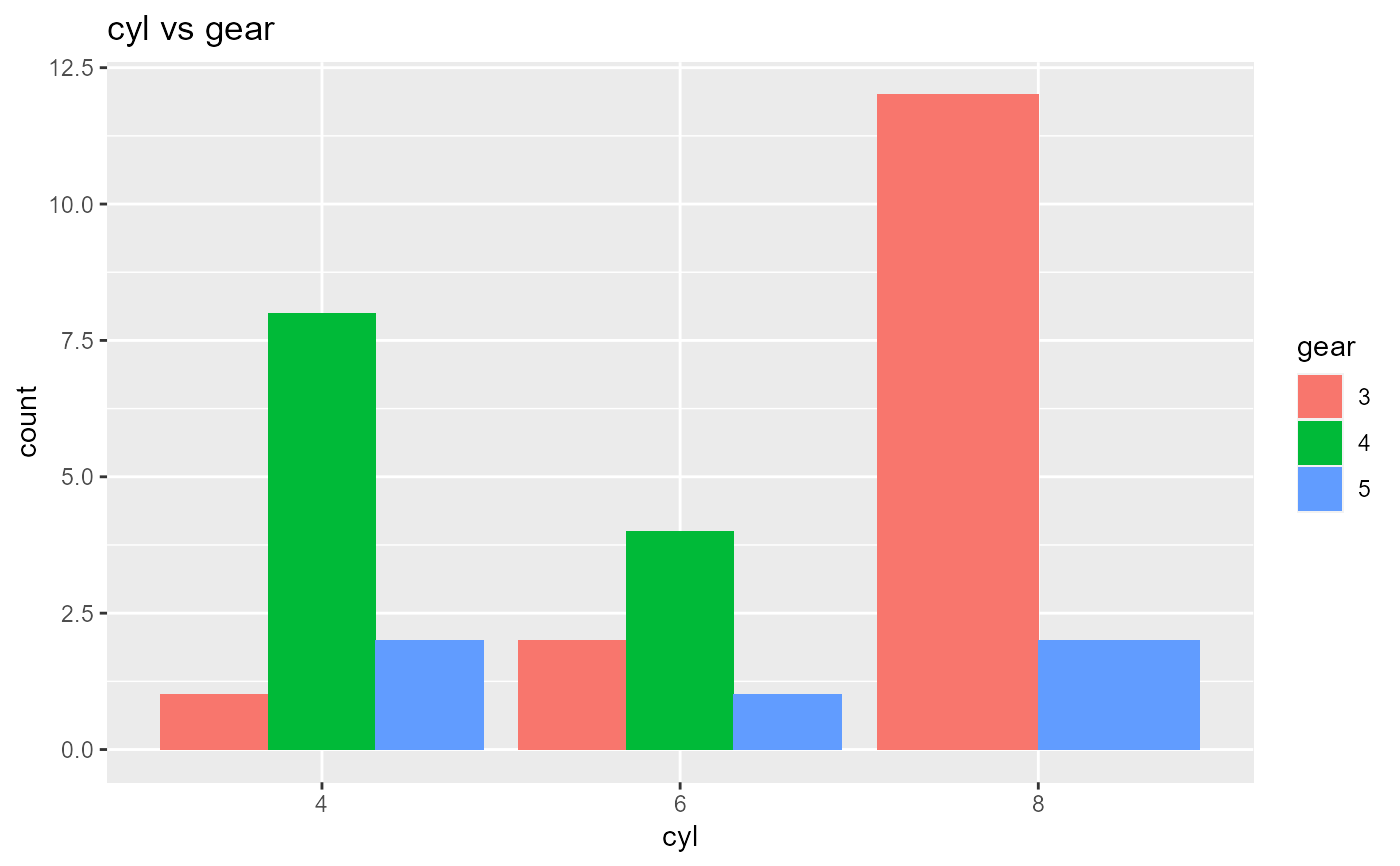
# bar plot
plot(k)
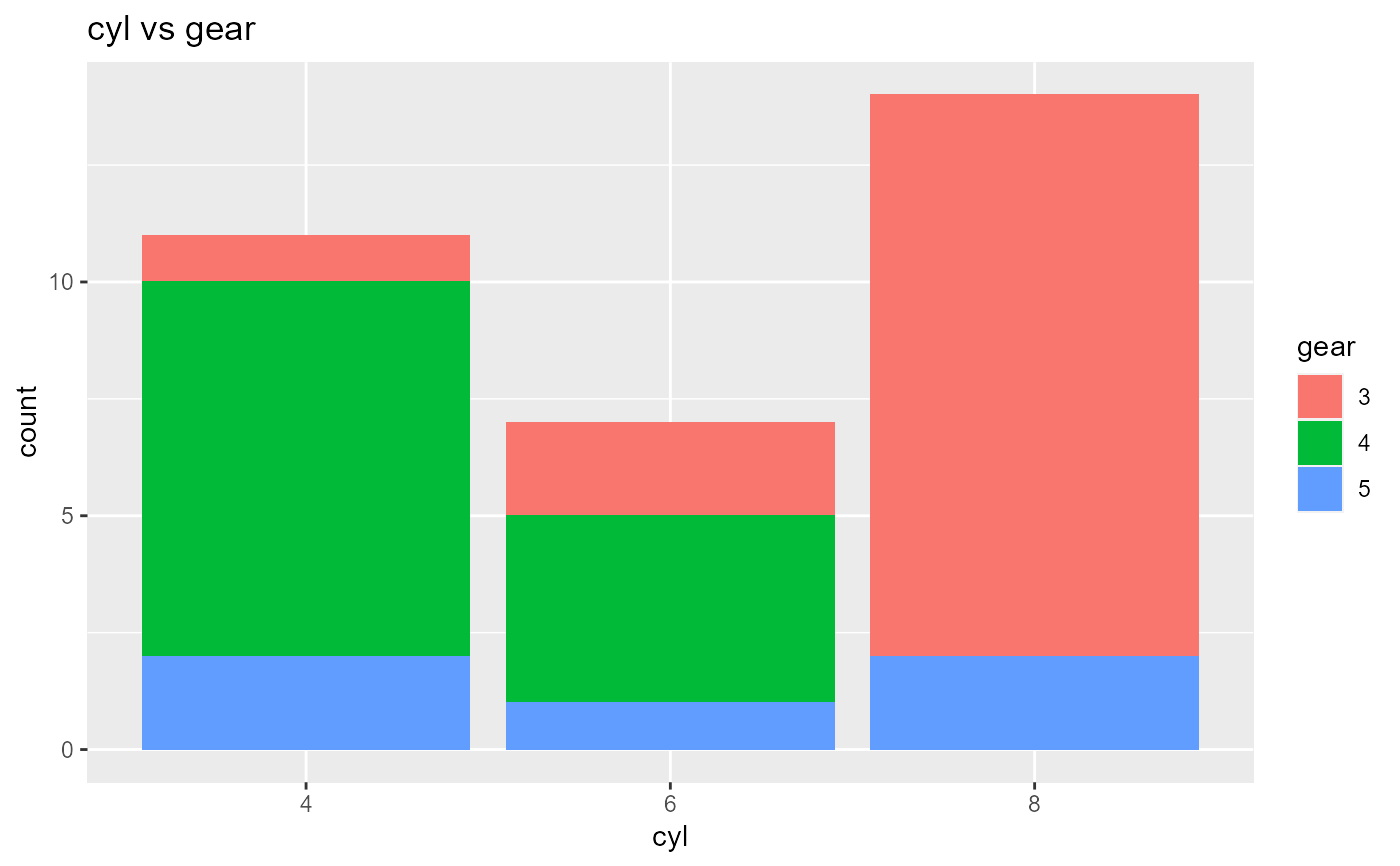
 # stacked bar plot
plot(k, stacked = TRUE)
# stacked bar plot
plot(k, stacked = TRUE)
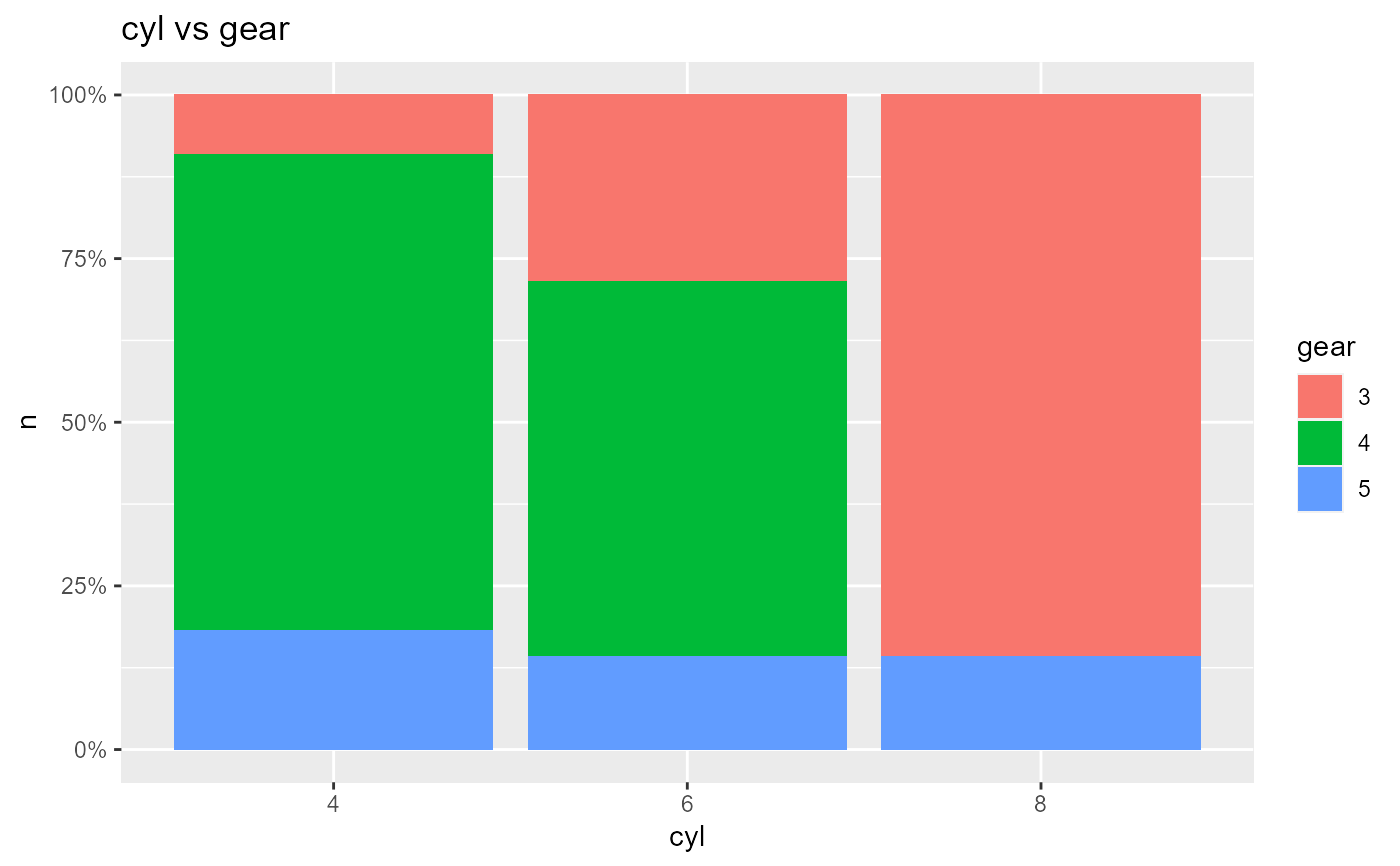
 # proportional bar plot
plot(k, proportional = TRUE)
# proportional bar plot
plot(k, proportional = TRUE)
 # returns tibble
ds_twoway_table(mtcarz, cyl, gear)
#> Joining with `by = join_by(cyl, gear, count)`
#> # A tibble: 8 × 6
#> cyl gear count percent row_percent col_percent
#> <fct> <fct> <int> <dbl> <dbl> <dbl>
#> 1 4 3 1 0.0312 0.0909 0.0667
#> 2 4 4 8 0.25 0.727 0.667
#> 3 4 5 2 0.0625 0.182 0.4
#> 4 6 3 2 0.0625 0.286 0.133
#> 5 6 4 4 0.125 0.571 0.333
#> 6 6 5 1 0.0312 0.143 0.2
#> 7 8 3 12 0.375 0.857 0.8
#> 8 8 5 2 0.0625 0.143 0.4
# returns tibble
ds_twoway_table(mtcarz, cyl, gear)
#> Joining with `by = join_by(cyl, gear, count)`
#> # A tibble: 8 × 6
#> cyl gear count percent row_percent col_percent
#> <fct> <fct> <int> <dbl> <dbl> <dbl>
#> 1 4 3 1 0.0312 0.0909 0.0667
#> 2 4 4 8 0.25 0.727 0.667
#> 3 4 5 2 0.0625 0.182 0.4
#> 4 6 3 2 0.0625 0.286 0.133
#> 5 6 4 4 0.125 0.571 0.333
#> 6 6 5 1 0.0312 0.143 0.2
#> 7 8 3 12 0.375 0.857 0.8
#> 8 8 5 2 0.0625 0.143 0.4