Creates bar plots if the data has categorical variables.
Usage
ds_plot_bar(data, ..., fill = "blue", print_plot = TRUE)
Arguments
- data
A data.frame or tibble.
- ...
Column(s) in data.
- fill
Color of the bars.
- print_plot
logical; if TRUE, prints the plot else returns a plot object.
Examples
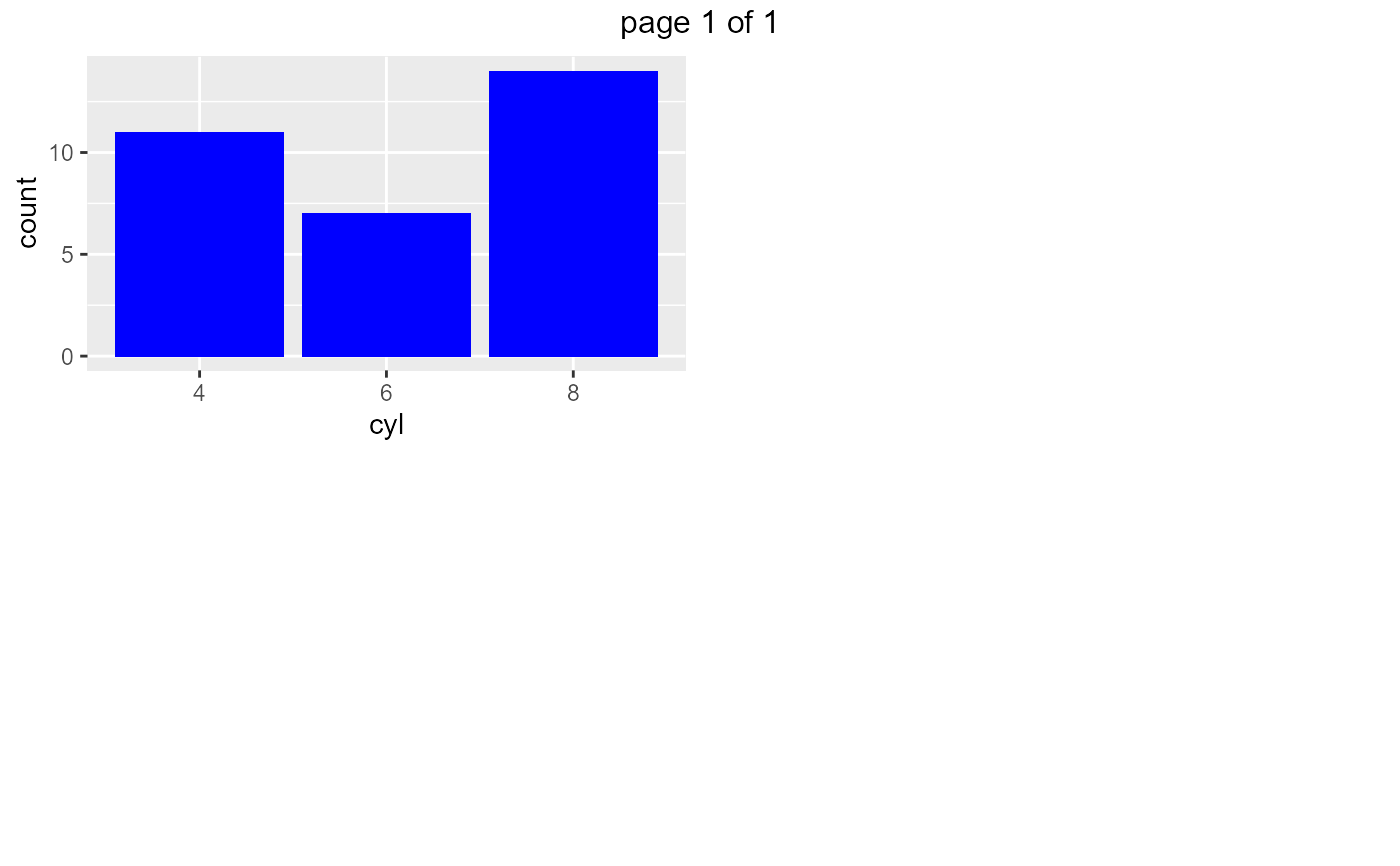
# plot single variable
ds_plot_bar(mtcarz, cyl)
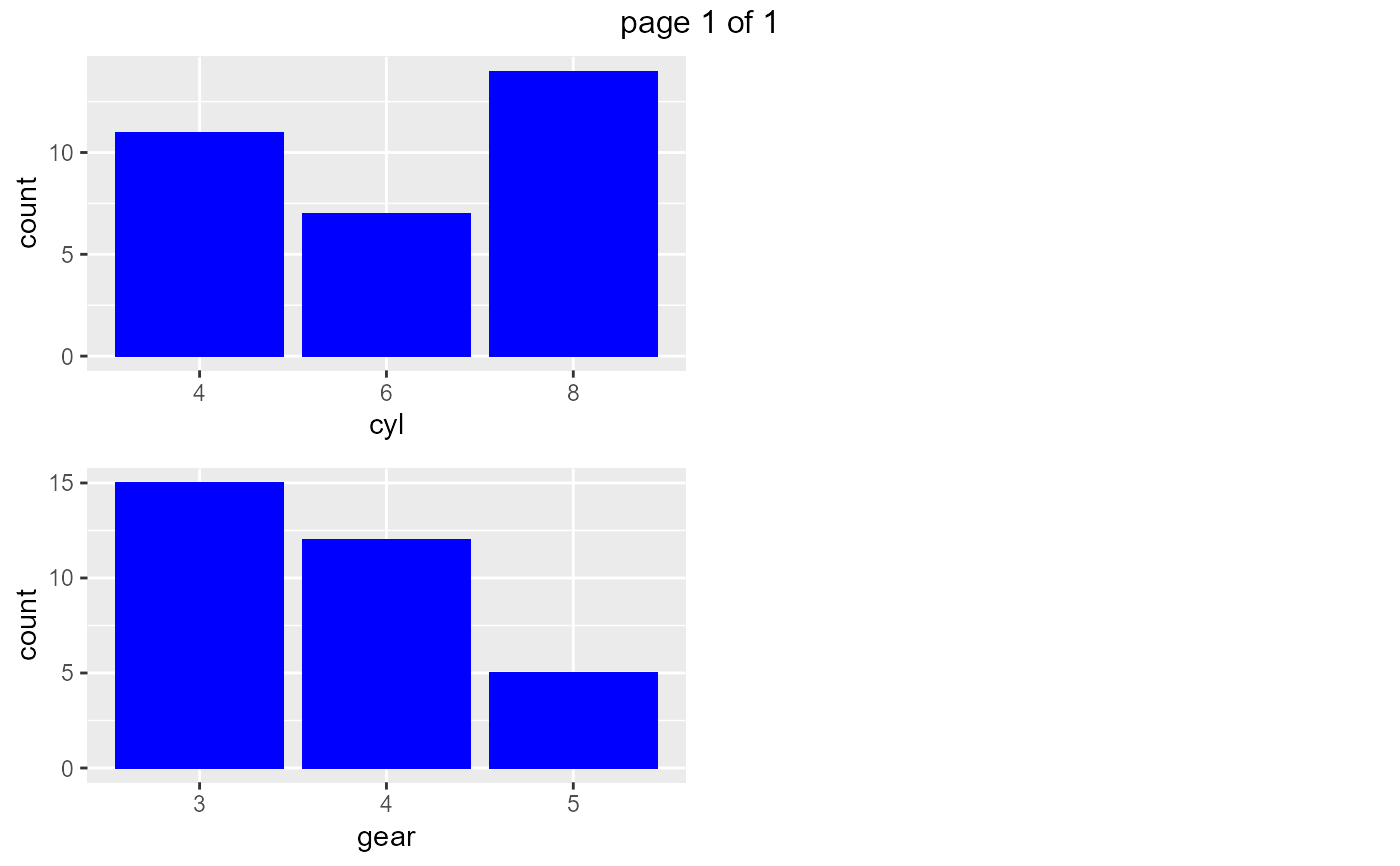
 # plot multiple variables
ds_plot_bar(mtcarz, cyl, gear)
# plot multiple variables
ds_plot_bar(mtcarz, cyl, gear)
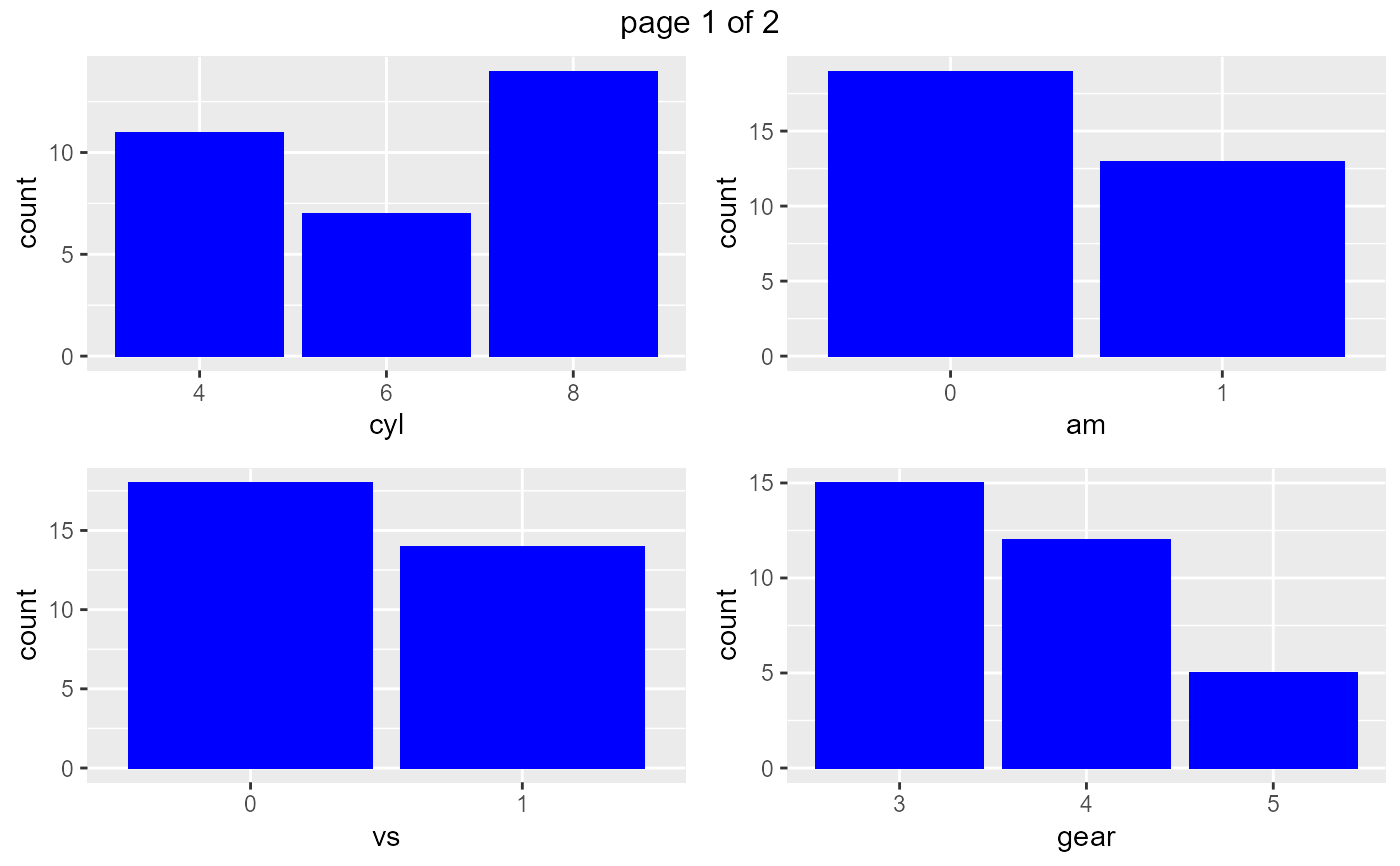
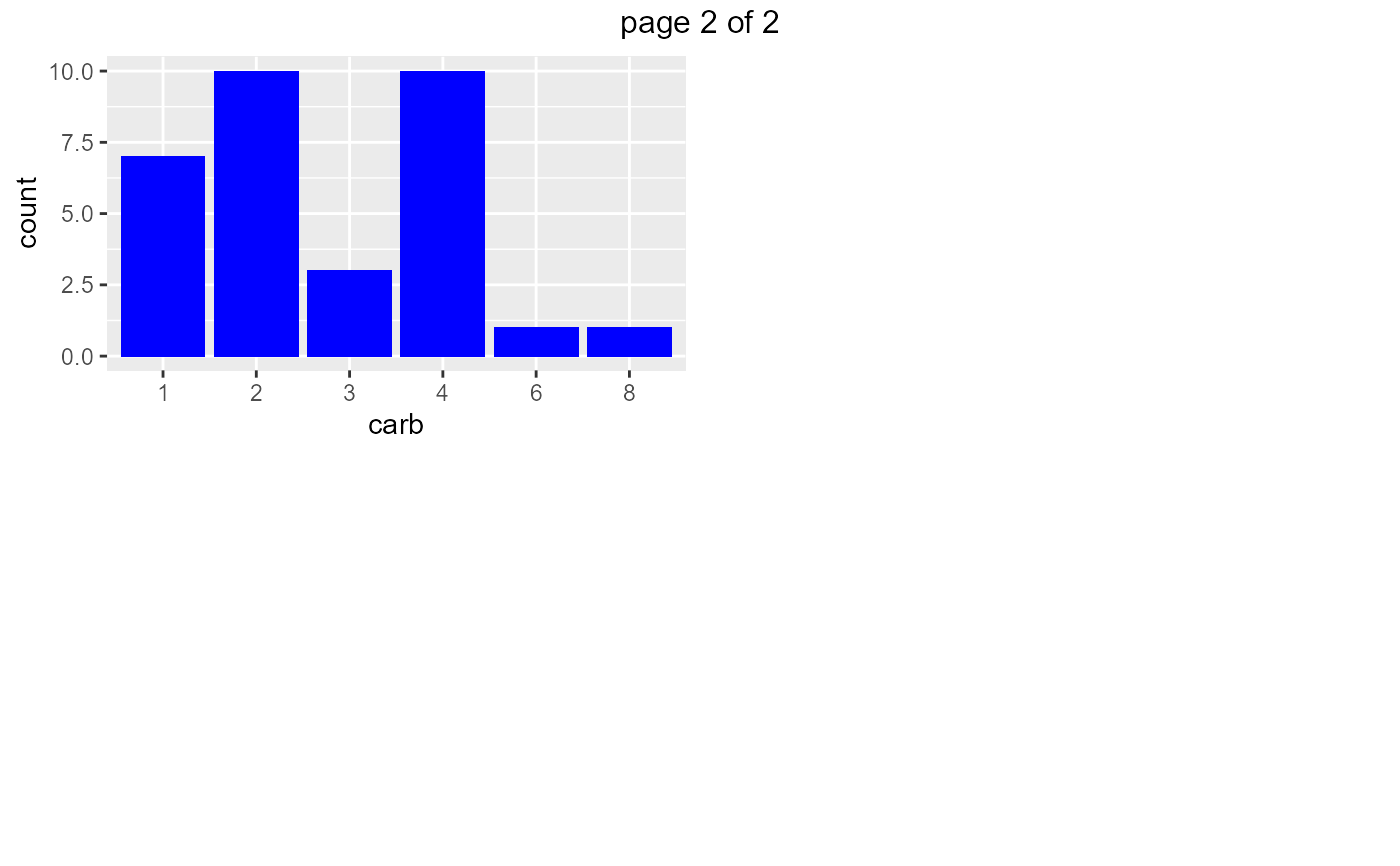
 # plot all variables
ds_plot_bar(mtcarz)
# plot all variables
ds_plot_bar(mtcarz)