Creates stacked bar plots if the data has categorical variables.
Examples
# subset data
mt <- dplyr::select(mtcarz, cyl, gear, am)
# stacked bar plot
ds_plot_bar_stacked(mtcarz, cyl, gear)
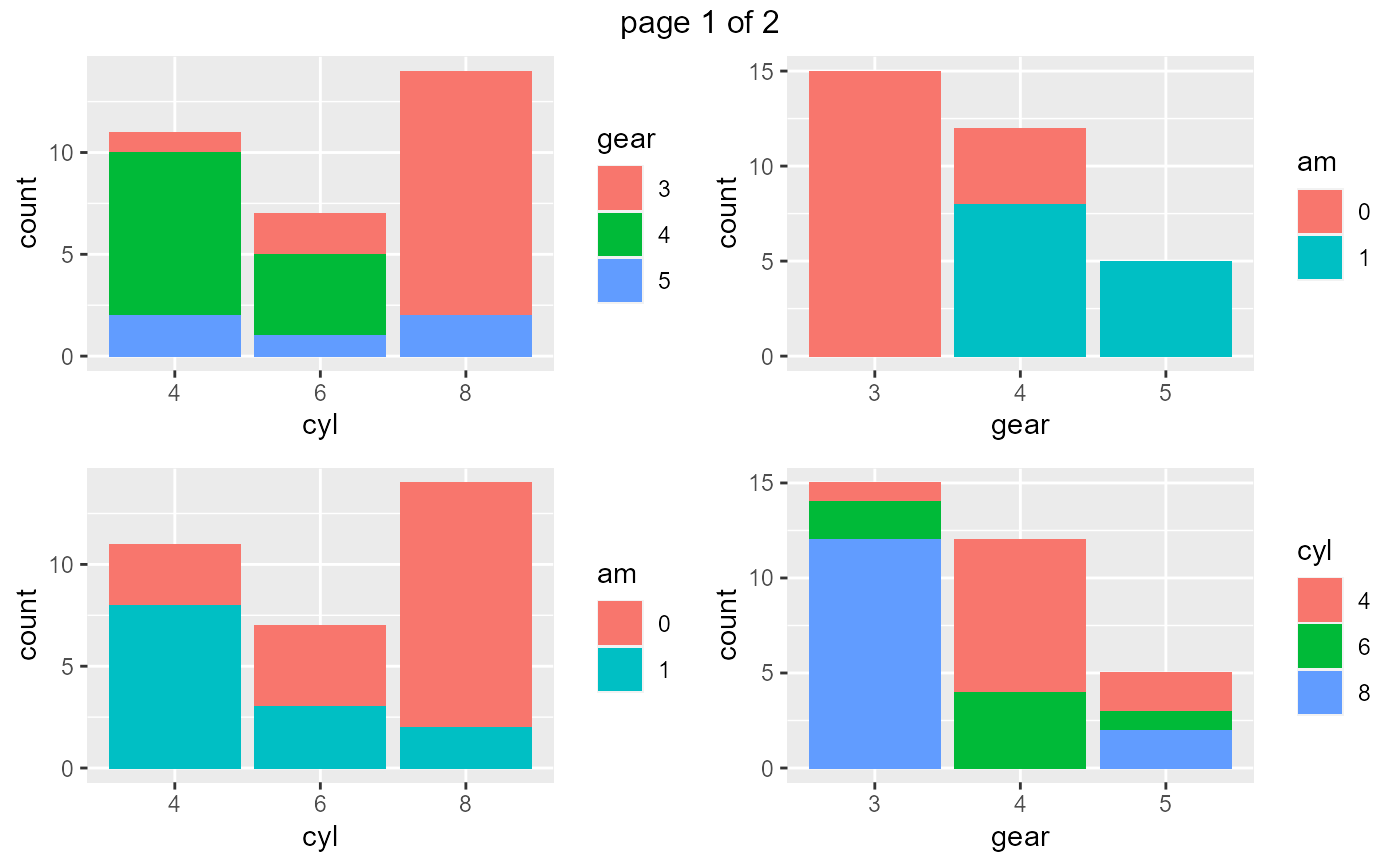
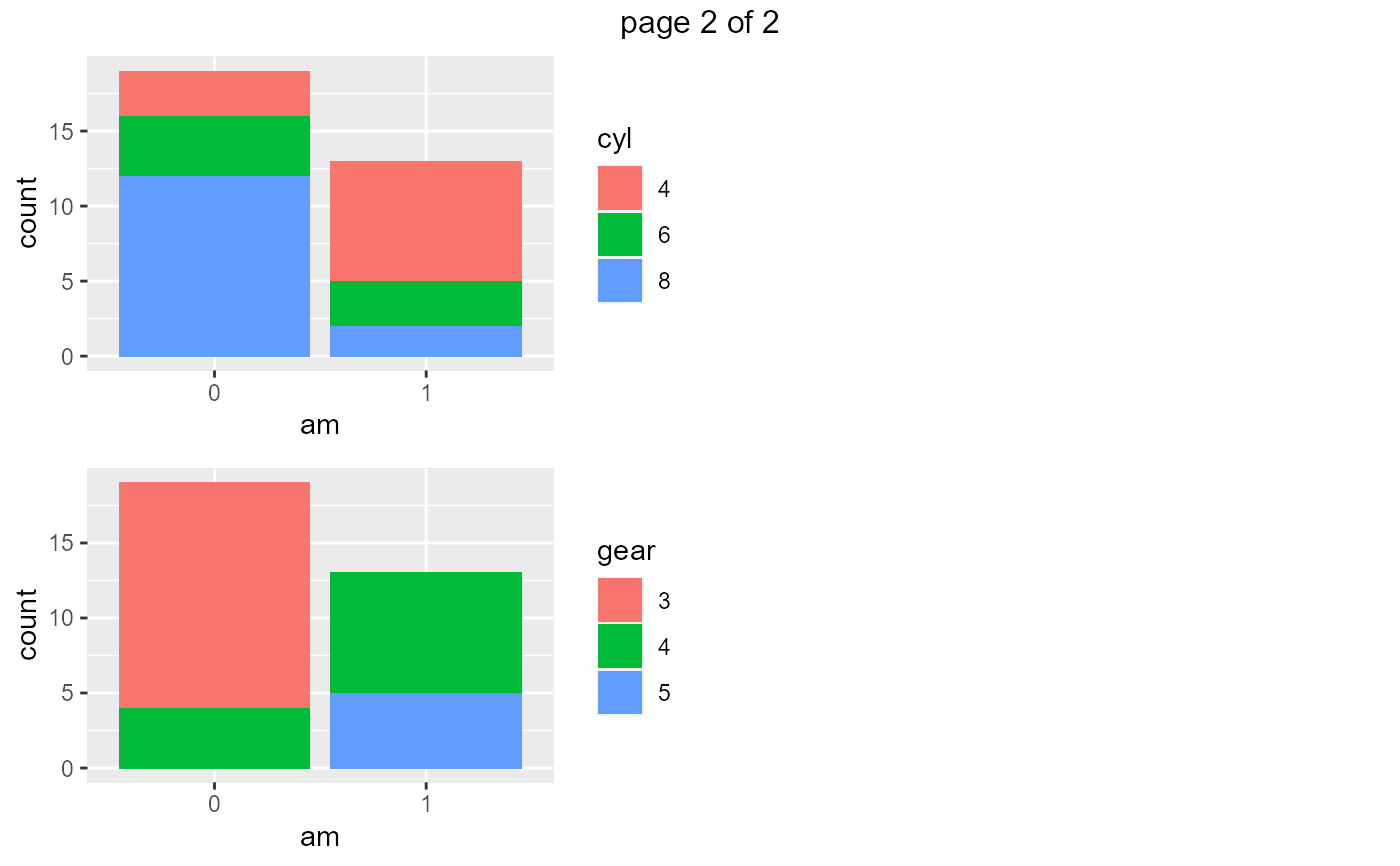
 # plot all variables
ds_plot_bar_stacked(mt)
# plot all variables
ds_plot_bar_stacked(mt)
Creates stacked bar plots if the data has categorical variables.
# subset data
mt <- dplyr::select(mtcarz, cyl, gear, am)
# stacked bar plot
ds_plot_bar_stacked(mtcarz, cyl, gear)
# plot all variables
ds_plot_bar_stacked(mt)