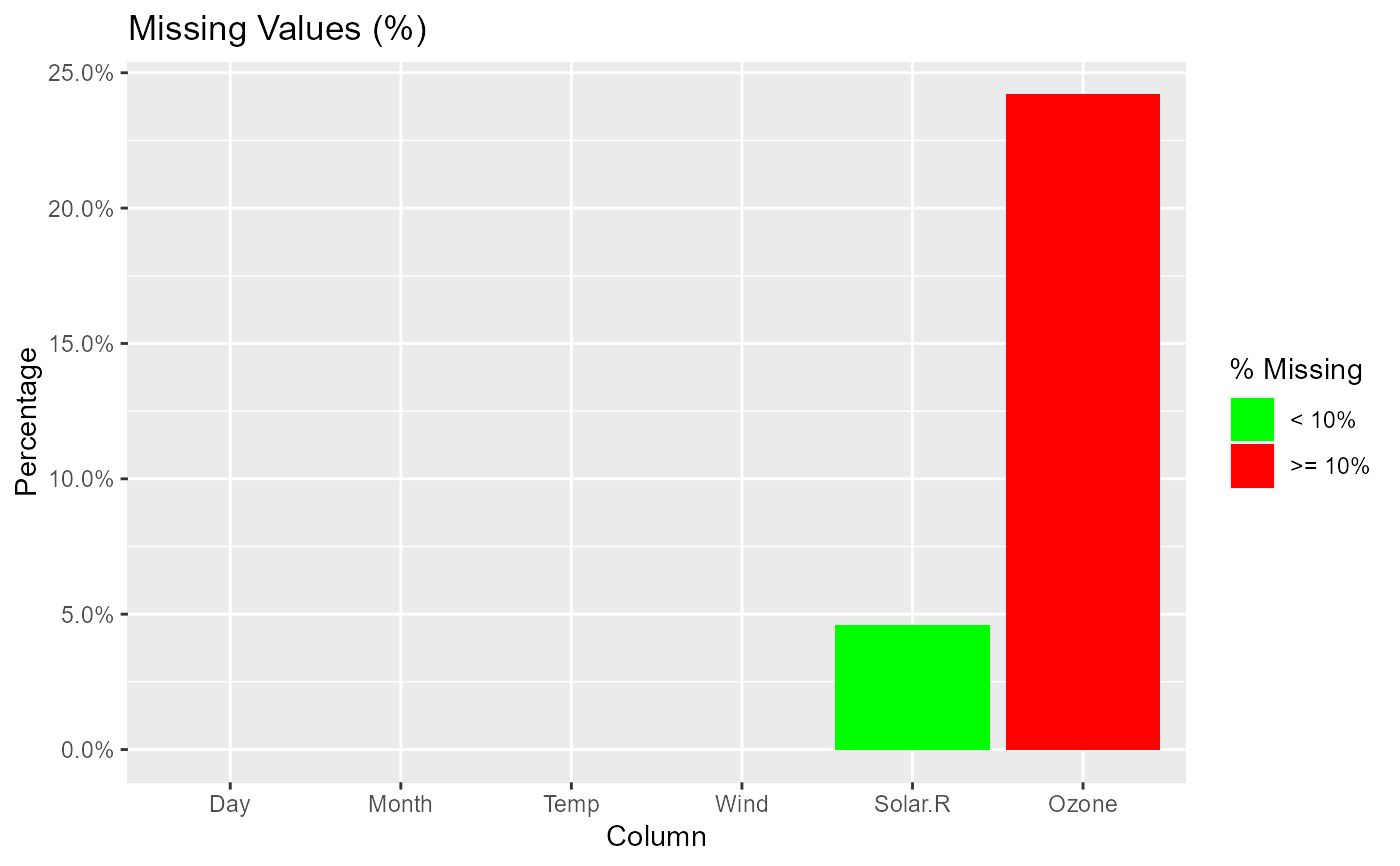
Screen data and return details such as variable names, class, levels and
missing values. plot.ds_screener() creates bar plots to visualize
of missing observations for each variable in a data set.
Usage
ds_screener(data)

# S3 method for class 'ds_screener'
plot(x, ...)Value
ds_screener() returns an object of class "ds_screener".
An object of class "ds_screener" is a list containing the
following components:
- Rows
Number of rows in the data frame.
- Columns
Number of columns in the data frame.
- Variables
Names of the variables in the data frame.
- Types
Class of the variables in the data frame.
- Count
Length of the variables in the data frame.
- nlevels
Number of levels of a factor variable.
- levels
Levels of factor variables in the data frame.
- Missing
Number of missing observations in each variable.
- MissingPer
Percent of missing observations in each variable.
- MissingTotal
Total number of missing observations in the data frame.
- MissingTotPer
Total percent of missing observations in the data frame.
- MissingRows
Total number of rows with missing observations in the data frame.
- MissingCols
Total number of columns with missing observations in the data frame.
Examples
# screen data
ds_screener(mtcarz)
#> -----------------------------------------------------------------------
#> |  Column Name  |  Data Type  |  Levels   |  Missing  |  Missing (%)  |
#> -----------------------------------------------------------------------
#> |      mpg      |   numeric   |    NA     |     0     |       0       |
#> |      cyl      |   factor    |   4 6 8   |     0     |       0       |
#> |     disp      |   numeric   |    NA     |     0     |       0       |
#> |      hp       |   numeric   |    NA     |     0     |       0       |
#> |     drat      |   numeric   |    NA     |     0     |       0       |
#> |      wt       |   numeric   |    NA     |     0     |       0       |
#> |     qsec      |   numeric   |    NA     |     0     |       0       |
#> |      vs       |   factor    |    0 1    |     0     |       0       |
#> |      am       |   factor    |    0 1    |     0     |       0       |
#> |     gear      |   factor    |   3 4 5   |     0     |       0       |
#> |     carb      |   factor    |1 2 3 4 6 8|     0     |       0       |
#> -----------------------------------------------------------------------
#>
#>  Overall Missing Values           0
#>  Percentage of Missing Values     0 %
#>  Rows with Missing Values         0
#>  Columns With Missing Values      0
ds_screener(airquality)
#> ----------------------------------------------------------------------
#> |  Column Name  |  Data Type  |  Levels  |  Missing  |  Missing (%)  |
#> ----------------------------------------------------------------------
#> |     Ozone     |   integer   |    NA    |    37     |     24.18     |
#> |    Solar.R    |   integer   |    NA    |     7     |     4.58      |
#> |     Wind      |   numeric   |    NA    |     0     |       0       |
#> |     Temp      |   integer   |    NA    |     0     |       0       |
#> |     Month     |   integer   |    NA    |     0     |       0       |
#> |      Day      |   integer   |    NA    |     0     |       0       |
#> ----------------------------------------------------------------------
#>
#>  Overall Missing Values           44
#>  Percentage of Missing Values     4.79 %
#>  Rows with Missing Values         42
#>  Columns With Missing Values      2

# plot
x <- ds_screener(airquality)
plot(x)
